Modeling the Renaissance: A Historical Art Network Using Computational Methods in R and Gephi
Tutorial statement (2025 revised version) : This is a revised version (2025) of a statement I originally wrote a few years ago about the tutorial. (Renaissance Network Gephi file (2025 ver.))
Motivation
The “Renaissance Network (Web Crawling, R, Gephi)” tutorial offers an example of how computational and network-based methodologies can illuminate the hidden complexity of cultural and historical systems. By combining web-based data collection, data processing in R, and visual analysis in Gephi, it demonstrates not only a practical workflow but also a broader epistemological shift: from describing isolated events to tracing the interconnected networks that underpin artistic, intellectual, and social production. Yet the deeper value of such methods lies not merely in visualization or measurement, but in their capacity to nurture emergent discovery—a process that transforms how research questions themselves evolve.
As Uri Alon (2009) observes, inquiry in complex systems rarely follows a linear path from question to answer but instead moves through a “cloud” filled with confusion, where initial hypotheses encounter unexpected results and ambiguity. Far from being a setback, this stage becomes a nurturing environment in which more compelling and feasible questions emerge, transforming uncertainty into discovery through iterative exploration. Maximilian Schich’s (2016) research on cultural networks illustrates how cultural structures arise from the aggregation of local activities, as the interactions of artists, patrons, and institutions generate large-scale patterns of change. When mapped as networks, these relationships reveal emergent order, patterns that arise not through deliberate design but through the dynamic interplay of countless individual choices.
As a researcher of complex adaptive systems, I believe this perspective holds profound implications for art and cultural history. Rather than viewing history as a linear sequence of events or a collection of isolated figures, network methodologies allow us to understand it as a self-organizing system, a living web of relationships among people, objects, and ideas. Through computational mapping, we can uncover not only central figures and major movements but also the overlooked intermediaries and hidden conduits of influence that shape cultural evolution. The methodological integration of R, Gephi, and web-based data collection thus offers a powerful framework for examining how complexity itself drives the emergence and transformation of culture.
Motivated by this perspective, I was inspired during my doctoral studies by a network visualization of Renaissance culture that hung on the wall of Dr. Schich’s lab. Seeking to recreate its essence in a more accessible form, I developed the Renaissance Network — a project that combined web crawling in R with visualization in Gephi, later evolving into a tutorial platform. By embracing complexity as a generative condition rather than a barrier, this approach invites us to reimagine both our data and our questions. The 2025 version of the Renaissance Network further expands this vision by incorporating temporal (year) and geographic (latitude and longitude) dimensions, allowing the network to unfold across both time and space.
Intellectual Positioning of Computational Art History
The intersection of network analysis and the humanities has drawn increasing scholarly attention. The introduction of new methodologies inevitably raises questions about their relationship to established forms of inquiry. How should we understand the role of computational methods within humanistic research? In the context of historical or art-historical analysis, there is justified caution toward treating network models as deterministic representations of culture or history. Yet, the adoption of such tools remains deeply promising.
Lemercier (2015) argues that formal network analysis allows scholars to move beyond vague relational metaphors and to produce precise, testable historical claims about ties, structures, and change. From this perspective, network analysis is not an optional supplement but a necessary methodological extension for historians. Similarly, Kienle (2017) and Zapata (2024) view computational art history as a methodological expansion that adds new interpretive layers, connecting qualitative inquiry with quantitative computation and enriching the ways we understand artistic and cultural production.
Taken together, these studies suggest that network analysis should complement rather than replace the interpretive traditions of art history. My own framework aligns with this balanced position: computational tools serve as scaffolding for discovery and reflection, offering new pathways for interpretation while preserving the centrality of humanistic insight.
Data Acquisition : Web crawling
The starting point of this framework is web crawling, as demonstrated in the tutorial. The data collection process begins with the Wikipedia page “List of Renaissance Figures”, which provides the foundational set of nodes. Each person listed on that page becomes a node in the network. Then, for each figure’s individual Wikipedia page, the script checks whether other figures from the same list are mentioned; when such a reference is found, an edge(link) is created between them. For instance, if the Wikipedia page for Leonardo da Vinci mentions Michelangelo, and Michelangelo also appears in the list of Renaissance figures, an edge is drawn from Leonardo da Vinci to Michelangelo. The R-based web crawler automates this process by visiting each figure’s Wikipedia page, identifying co-occurring figures, and recording the resulting connections.
The 2025 version refines this approach to enable more efficient and detailed data collection. Its most significant enhancement is the addition of temporal and spatial information—integrating both time(year) and coordinates(latitude and longitude) into the dataset. The temporal dimension represents the year of birth for each figure, while the spatial dimension is based on the place of death. This choice reflects a practical and interpretive rationale: within the European context, an individual’s birthplace often differs from their main sphere of activity, whereas the place of death frequently corresponds more closely to where they lived or worked in their later years. In cases where the death location is unknown or ambiguous—such as for "Explorers and Navigators" who may have died at sea or outside Europe—the birthplace coordinates are used instead.
Through this process, the dataset encompasses 234 nodes, organized into nine categories - Artists and Architects, Composers, Writers, Explorers and navigators, Philosophers, Mathematicians, Humanists, Dancing masters, Other influential people - each annotated with temporal and spatial attributes. It also includes 1,497 edges representing the relational ties among these figures. This workflow transforms dispersed web-based information into a relational data infrastructure, providing a solid foundation for complex network analysis that bridges art historical inquiry with computational methods.
Visualization in Gephi
Gephi
Network visualization can be implemented through various approaches. Both R and Python offer extensive libraries for this purpose—such as 'igraph' in R and 'networkx' in Python— that allow for analytical and visual exploration within a programmable environment. However, I chose Gephi for its intuitive interface and ability to interactively observe the evolution of network structures.
Although Gephi is not the most stable software, and occasionally limited in handling large datasets, it remains unmatched among non-programmatic visualization tools. It provides a flexible workspace for dynamic experimentation with layouts, color schemes, node attributes, and filters.
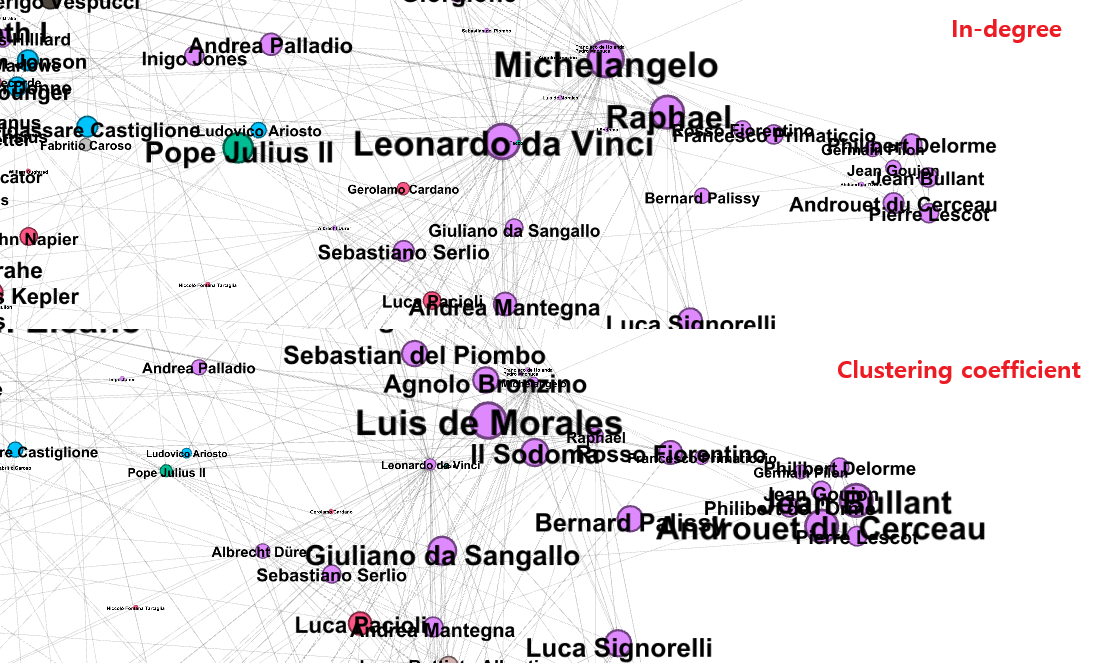
Nodes, Edges, Degree, and Clustering coefficient
As noted earlier, the Renaissance Network comprises nine categories of figures — such as Artists and Architects, Mathematicians, and Writers — distinguished by node color. The network is directional, meaning each edge has a defined direction of reference, though no weight is assigned.
Node size is determined by in-degree, which measures how many other figures reference a given individual. A node with high in-degree, therefore, represents a figure who is frequently mentioned or acknowledged by others. In historical terms, this reflects someone recognized as foundational or exemplary, or a polymath whose contributions extended across multiple fields.
Gephi allows for flexible manipulation of both node and edge properties, enabling experimentation with different scaling parameters. In addition to in-degree, I also scaled node size according to the clustering coefficient, which measures how tightly connected a node’s neighbors are— that is, how cohesive the local structure around a node is.
A high clustering coefficient indicates that a figure belongs to a tightly knit community, suggesting intensive local collaboration or influence. Geographically, a high clustering coefficient can be interpreted as evidence of localized interaction, where artistic or intellectual exchange was spatially concentrated (for example, within Florence or Paris). Conversely, a low clustering coefficient does not imply isolation. Instead, it often signifies a bridge node— a figure linking otherwise separate communities, serving as a conduit for influence across clusters or disciplines.
Layout Algorithms
As the number of nodes and edges increases, the clarity of visualization typically decreases— large, dense networks tend to appear like tangled threads. Gephi provides a range of layout algorithms for arranging nodes and edges. Each algorithm has unique spatial logic, so no single layout can be considered universally superior.
For the Renaissance Network, I employed two layouts :MultiGravity ForceAtlas2 - This algorithm pulls strongly connected nodes together while pushing weakly connected nodes apart, creating visually distinct clusters. Parameters such as Prevent Overlap, LinLog Mode, and Gravity allow fine control over spacing and clustering density.
The first animated visualization includes two sequences: one where node size corresponds to in-degree, and another where it scales with clustering coefficient. Over time, nodes appear sequentially, revealing the gradual formation of clusters. Distinct groupings emerge—most notably a green cluster representing Composers— whose members interact primarily within their own category rather than across disciplines.
As expected, figures such as Leonardo da Vinci, Michelangelo, Erasmus, and Thomas More appear with large nodes in the in-degree visualization, reflecting their wide recognition. Interestingly, in the clustering coefficient visualization, some of these prominent figures’ nodes shrink in size—particularly Leonardo da Vinci and Thomas More. This suggests their role as bridges connecting different clusters rather than as members of a single tightly bound circle.
Geo Layout - The second layout, Geo Layout, maps nodes according to their geographical coordinates (latitude and longitude). By linking the network’s coordinate data to these parameters, each figure is positioned geographically.
The second animation also consists of two versions—one based on in-degree, the other on clustering coefficient. As the timeline progresses, highly concentrated clusters appear. Compared to ForceAtlas2, nodes are so densely grouped that individual structures are difficult to distinguish—an expected result given the geographical centralization of Renaissance activity.
After 1400, Florence becomes the dominant region, showing a surge of figures with high in-degree and large node size. Over time, dense overlapping of nodes and edges occurs in certain regions, emphasizing the regional concentration of influence. This reinforces the value of using multiple layout algorithms: ForceAtlas2 for structural relationships, and Geo Layout for spatial and temporal diffusion.
In this layout, the earliest major node in Florence is The Medici. Although its in-degree is modest, its clustering coefficient is relatively high, highlighting its role as a hub of artistic patronage—a central actor facilitating cohesion within Florence’s artistic network. After the formation of this Florentine cluster, another significant hub emerges in France, where large nodes appear around Johannes Ockeghem. Following the emergence of the prominent node Thomas More, the late 15th century in England reveals an increasing number of large nodes, signaling the broader diffusion of the Renaissance into the English cultural sphere.
Filtered Visualizations - The third animation demonstrates Gephi’s filtering feature applied to specific categories.
The first filter isolates Artists and Architects. Here, the Florentine cluster appears particularly prominent, centered around figures such as Leonardo da Vinci, Michelangelo, and Giuliano da Sangallo. Following Sebastiano Serlio, larger nodes begin to emerge in France, revealing the northward migration of architectural influence.
The second filter focuses on Composers. As observed earlier in the ForceAtlas2 visualization, this category exhibits strong internal connectivity but limited interaction with other disciplines. Interestingly, the Florentine dominance seen in the visual arts does not appear here. Instead, composers form several medium-sized clusters across Italy —outside Florence, particularly around Venice and Rome — as well as in parts of Western Europe. Beginning with Gilles Binchois, notable clusters emerge in French-speaking regions, and following John Taverner, larger nodes appear in English-speaking areas, reflecting the diffusion of musical influence beyond Italy.
Together, these visualizations illustrate how network visualization tools like Gephi make it possible to interpret Renaissance cultural history through the lens of relational structure, spatial distribution, and temporal evolution. By mapping both influence and interaction, the Renaissance Network reveals not only who was central but also how clusters formed, connected, and evolved—transforming static historical data into a dynamic portrait of cultural interconnection.
Challenges & Limitations
Applying a web crawling approach to a historical context inevitably presents several challenges and limitations.
First, web crawling always carries the risk of malfunction or misclassification. The R code used in this project performs relatively simple operations—visiting the web pages corresponding to each figure in the List of Renaissance Figures and extracting information such as links, places of death, and birth years. However, even within Wikipedia, page structures and formatting are not uniform. Small inconsistencies in markup or phrasing can lead to incorrect data extraction. While I corrected clear anomalies identified during network visualization, it is possible that other errors remain undetected. Such risks are inherent to any automated web-scraping process.
For verification, I initially considered integrating Google search results to cross-check extracted data. However, since Google does not permit automated web crawling of its search results, this approach was excluded from the current tutorial.
Second, there is the issue of source validity. Even though Wikipedia is one of the most accessible and frequently updated online resources, it is legitimate to question whether it accurately represents the historical relationships and spheres of influence among Renaissance figures. While I regard it as a useful and reasonably reliable resource for initial exploration, it cannot be considered a definitive reflection of Renaissance influence networks. Because Google-based crawling is restricted, identifying other suitable and crawlable databases—and securing multiple data sources for cross-validation—remains an essential but time-intensive task. Building a more robust dataset would thus require additional time, computational resources, and multi-source verification procedures.
The final challenge is even more complex and interpretive in nature. The mere presence of a name or hyperlink between figures does not necessarily indicate the type or magnitude of influence. A mention could signify admiration, critique, or even simple factual reference, and the frequency or context of that mention may vary widely. In other words, while the current network structure represents connections, it does not yet capture directionality of sentiment or intensity of influence. To address this, one would need to assign weights or even temporal dimensions to edges, reflecting how strongly and when one figure influenced another.
Achieving such precision would require incorporating text analysis — specifically, natural language processing techniques capable of extracting semantic meaning and relational cues from textual sources. This remains an open area of research that I am currently exploring. Extracting relational meaning from even a few sentences is a nontrivial task, requiring not only technical expertise but also collaboration with domain experts such as curators, art historians, and conservators who can interpret contextual nuance.
Ultimately, while web crawling provides a scalable method for constructing relational datasets from public sources, it also reveals the epistemological limits of automation in the humanities. Addressing these challenges demands not only better algorithms, but also humanistic interpretation and interdisciplinary collaboration, ensuring that computational tools remain in service of historical understanding rather than substituting for it.
Future Direction
Addressing all three challenges outlined above would require a substantial, multi-stage research project. Even solving the first issue—improving the reliability and consistency of web-crawled data—would already constitute a significant step forward in building a more robust and verifiable historical dataset.
Building on this foundation, my next goal is to model the temporal dynamics of Renaissance cultural and artistic relations. Cultural exchange and creative influence are not static phenomena; they evolve through time, shaped by geography, institutional networks, and shifting artistic movements. Capturing this temporal evolution computationally offers a way to move beyond static visualization and toward dynamic explanation.
One promising approach is the use of Temporal Exponential Random Graph Models (TERGMs), which estimate the probability of ties forming or dissolving over time, conditional on both node attributes (such as geography or category) and prior network structure. By integrating temporal dimensions, TERGMs enable researchers to infer not only who was connected, but when and under what conditions such connections emerged or disappeared.
Moreover, cultural and intellectual life in the Renaissance was inherently multiplex— composed of overlapping networks of patronage, artistic collaboration, intellectual correspondence, and institutional affiliation. Modeling these interactions as a multiplex network would allow us to observe how different types of relationships coexisted and influenced one another. For instance, one could test whether artistic collaboration tended to follow preexisting social or institutional ties, or whether cross-category relationships (e.g., between philosophers and artists) emerged independently of such structures.
Ultimately, this direction moves the Renaissance Network project from descriptive visualization toward analytical modeling, linking computational methods with historical interpretation. By integrating temporal and multiplex perspectives, the network becomes not merely a map of past connections, but a model for understanding the processes of cultural evolution—how ideas, styles, and influences circulated, transformed, and persisted across time and space.
Conclusion
The Renaissance Network tutorial may be more than a technical exercise. It can serve as a conceptual invitation to reimagine art and intellectual history as a fundamentally networked phenomenon. By integrating web crawling, R-based data analysis, and Gephi visualization, it offers a practical gateway into understanding complexity as an emergent property of cultural interaction. The framework developed here extends this foundation into a broader research paradigm— the self-organizing dynamics of interconnected lives, ideas, and influences.
References
Alon, Uri. (2009). How To Choose a Good Scientific Problem. Molecular Cell, 35(6), 726–728.
Kienle, M. (2017). Between Nodes and Edges: Possibilities and Limits of Network Analysis in Art History. Artl@s Bulletin, 6(3).
Lemercier, C. (2015). Formal network methods in history: Why and how? In G. Fertig (Ed.), Rural History in Europe (Vol. 11, pp. 281–310). Brepols Publishers.
Schich, Maximilian. (2016). Figuring out Art History. International Journal for Digital Art History 2.
Zapata, P. B. (2024). Evolving Methodologies: Computation in Art History. Hertziana Studies in Art History, 3.