The Two Regimes of Hospital Transmission (From Firebreak to Saturation): Network-Based SI Simulations of Hospital Contagious Risk
Motivation
This analysis advances a dynamic network modeling framework I originally developed for a tutorial series on temporal network analysis. While previous iterations focused on the technical implementation of dynamic network visualization (using Gephi) and simulation (using the R package EpiModel), this essay pivots toward applied policy inference. By adapting the foundational sensor data from Vanhems et al. (2013), I investigate how the “invisible architecture” of hospital contact patterns drives outbreak dynamics. The goal is to move beyond descriptive statistics to predictive modeling, offering concrete strategies for infection control in healthcare settings.
The Invisible Architecture of Hospital Contacts
Hospitals are structured contact environments. Unlike the “homogeneous mixing” assumption prevalent in basic compartmental models (where everyone is equally likely to infect everyone else), hospital transmission flows along specific pathways shaped by professional roles, workflows (e.g., morning rounds, shift handoffs), and spatial constraints.
Understanding this heterogeneity is critical. If contact patterns are structured, infection control policies should not be uniform. Instead, interventions can be optimized by targeting the specific times, roles, and relationships where transmission opportunities concentrate — essentially identifying the “structural bridges” of infection.
Data Source: Wearable Proximity Sensors
This study utilizes the proximity-sensor dataset reported by Vanhems et al. (2013), collected in a geriatric unit of a university hospital. The dataset offers granular insight into human interaction patterns:
- Spatial Resolution: Approximately 1–1.5 meters
- Temporal Resolution: Contacts recorded in 20-second intervals.
- Duration: Continuous monitoring over 4 days and 4 nights.
- Population (N=75): 29 Patients (PAT) and 46 Staff, comprising 27 Nurses/Aides (NUR), 11 Physicians (MED), and 8 Administrators (ADM).
The sensors recorded 14,037 distinct contact events totaling 648,480 seconds (~180 hours), providing a robust foundation for reconstructing the contact network.
Stylized Facts
Three key empirical regularities (stylized facts) emerge from the data, which serve as the boundary conditions for our model :
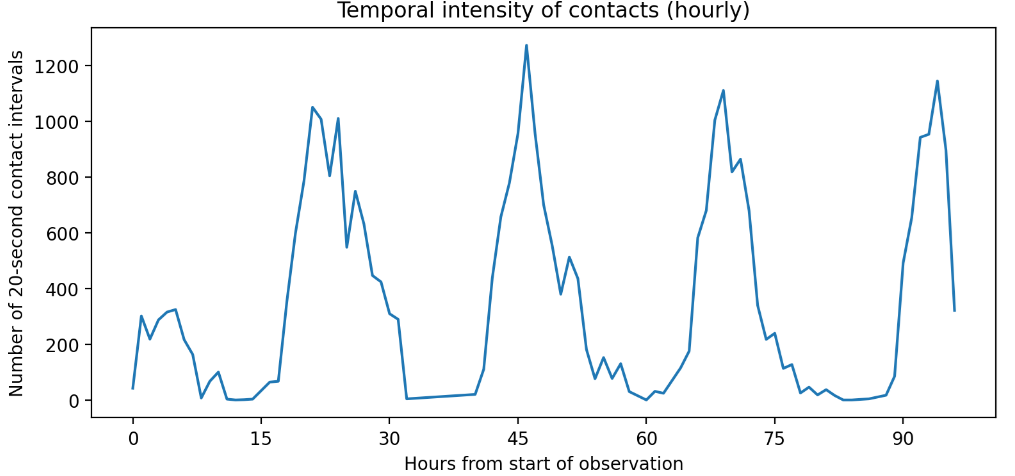
1. Strong Temporal Clustering
Activity is not constant. Contacts cluster heavily during daylight hours, with a distinct “morning peak” corresponding to medical rounds and care routines. Nights are effectively quiescent.
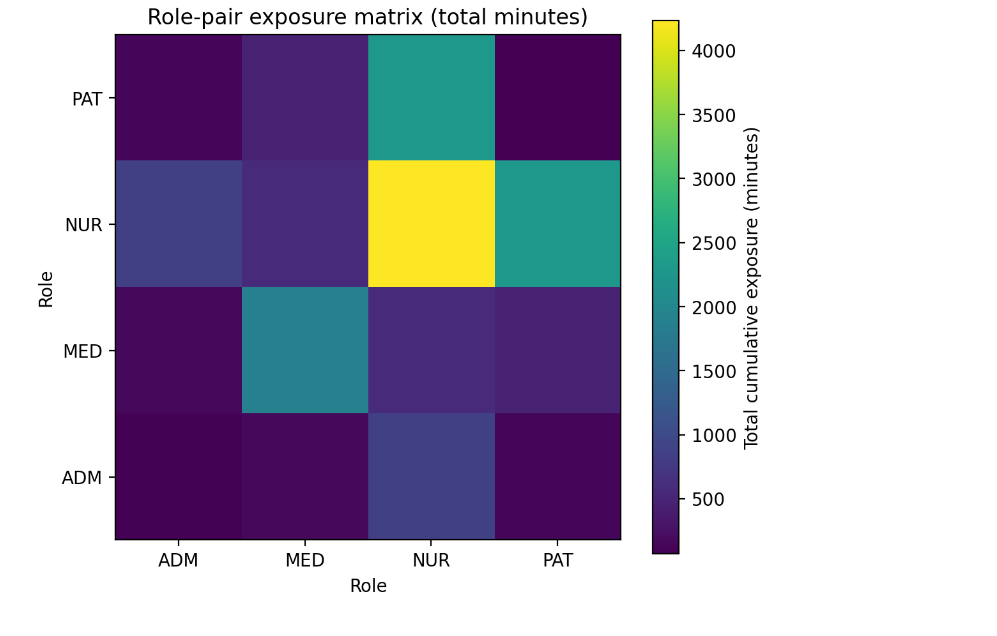
2. Role-Structured Mixing
Exposure is highly assortative by role. The contact matrices reveal that “Nurse-to-Nurse” and “Nurse-to-Patient” interactions dominate the network’s total edge weight. While the first fact reveals when risk is highest, this second fact reveals where risk flows. Resource allocation (PPE, screening) has a higher marginal benefit when aligned with these high-volume corridors.
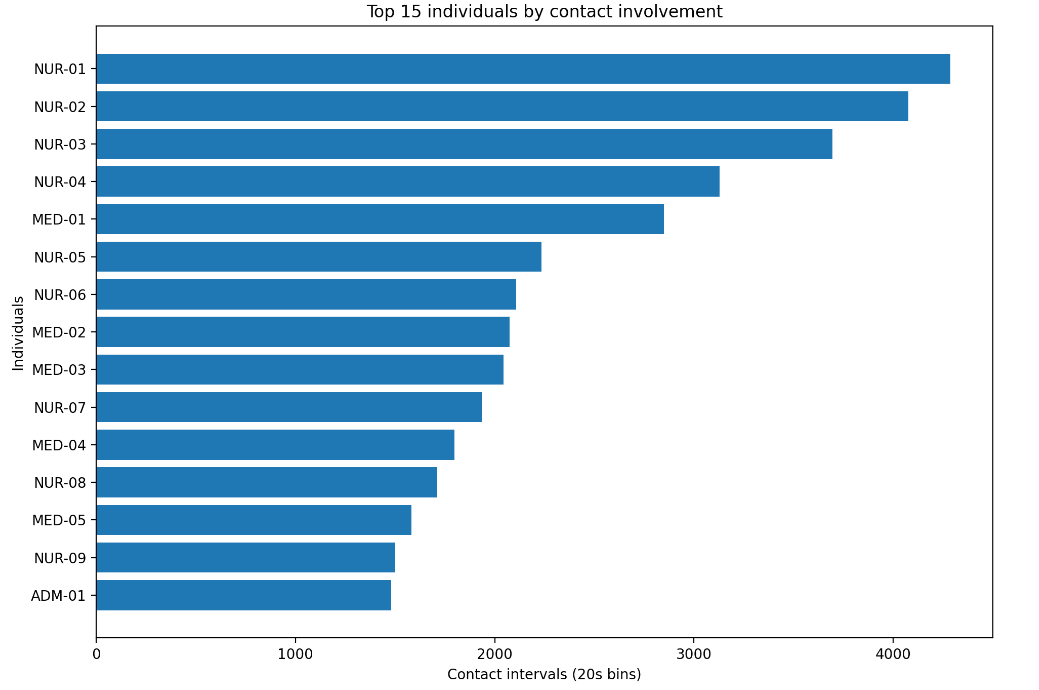
3. Concentrated Involvement (The 20/80 Rule)
A small subset of individuals — specifically, healthcare workers (HCWs) — accounts for a disproportionately large share of the total contact duration. 6 nurses (16% of HCWs) account for 42.1% of HCW–patient contacts and 44.3% of the cumulative duration of HCW–patient contacts. These “super-contactors” can act as network hubs.
Methodology: From Raw Signals to Epidemic Simulation (EpiModel)
Data Transformation: The Exposure Backbone
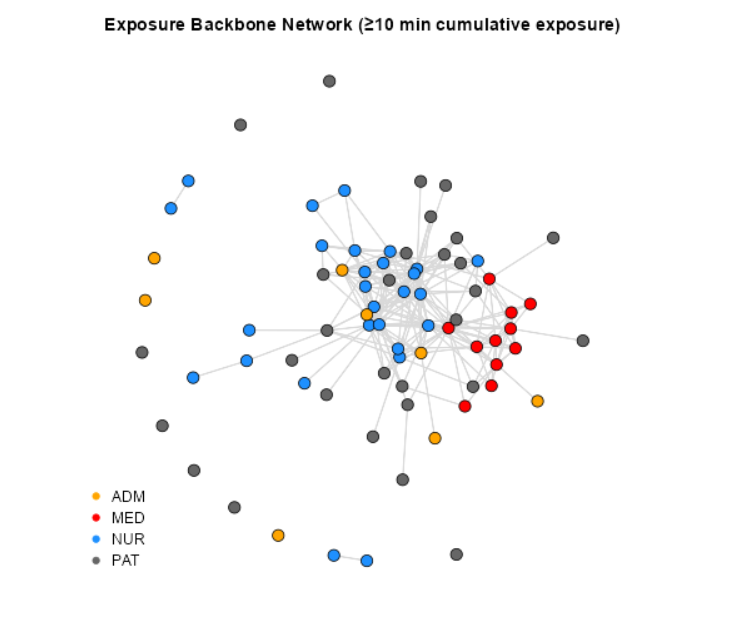
A raw contact network based on 20-second interactions is too noisy and dense for meaningful transmission modeling. To capture the effective transmission structure, I constructed a Cumulative Exposure Backbone Network.
- Edge Definition: An undirected edge exists between two individuals (i, j) if their cumulative face-to-face duration exceeds a threshold (≥ 10 minutes) over the observation window.
- Rationale: This filters out fleeting, low-risk encounters (e.g., passing in a hallway) and retains prolonged interactions where viral transmission is probable.
The resulting backbone network (N=75, E=238, Density = 0.086) reveals a core-periphery structure. Medical staff (MED) and Nurses (NUR) form a dense, interconnected core, while Patients (PAT) and Administrators (ADM) largely occupy the periphery.
Modeling Framework: Network Simulation with ERGMs
To simulate epidemics over dynamic networks, I utilized the EpiModel package in R. This framework integrates network estimation with disease simulation through a two-step workflow:
1. Network Estimation: An Exponential-family Random Graph Model (ERGM) is estimated to capture the structural properties of the observed contact network. EpiModel estimates a separable temporal ERGM (STERGM) by specifying (i) a formation model and (ii) a dissolution model.
2. Epidemic Simulation: Disease dynamics (e.g., SI, SIR) are simulated over dynamic networks generated from the estimated model. Mathematically, the probability of observing a specific network configuration y is given by the ERGM equation:
$$ \Pr(Y=y)=\frac{\exp\{\boldsymbol{\theta}^\top \mathbf{g}(y)\}}{\kappa(\boldsymbol{\theta})}, $$where \(Y\) is the adjacency matrix, \(\mathbf{g}(y)\) is a vector of network statistics (e.g., number of edges, mixing patterns by role), \(\boldsymbol{\theta}\) represents the model parameters, and \(\kappa(\boldsymbol{\theta})\) is a normalizing constant.
In this essay, the formation model is \(g(y) = (edges, nodefactor(label))\), which captures baseline density and differences in activity by role. Dissolution is modeled with \(offset(edges)\) and a specified mean edge duration.
Disease Dynamics: The SI Model
Given the hospital setting and the relatively short observation window, I employed a Susceptible-Infected (SI) model rather than an SIS or SIR model. This assumes that within the short timeframe, individuals do not recover or lose immunity.
Transmission Probability
Standard EpiModel simulations typically rely on two parameters:
- inf.prob: The probability of transmission per distinct contact act.
- act.rate: The average number of transmissible acts per partnership per unit time.
In the standard formulation, the transmission probability \(p_{ij}\) per step for a discordant edge (between an infected individual i and a susceptible individual j) is:
$$p_{ij} = 1 - (1-\texttt{inf.prob})^{\texttt{act.rate}}$$Here, if act.rate > 1, multiple acts within a time step reduce the probability of escaping infection (1-inf.prob).
Adaptation for Cumulative Exposure
However, as noted in the data transformation section, this study utilizes cumulative dyadic exposure based on a threshold (≥ 10 minutes). Therefore, I adapted the transmission probability to be a function of exposure duration:
$$p_{ij} = 1 - \exp(-\beta \, W_{ij}),$$where \(\beta\) represents the per-minute transmission hazard, and \(W_{ij}\) is the total contact time between individuals i and j.
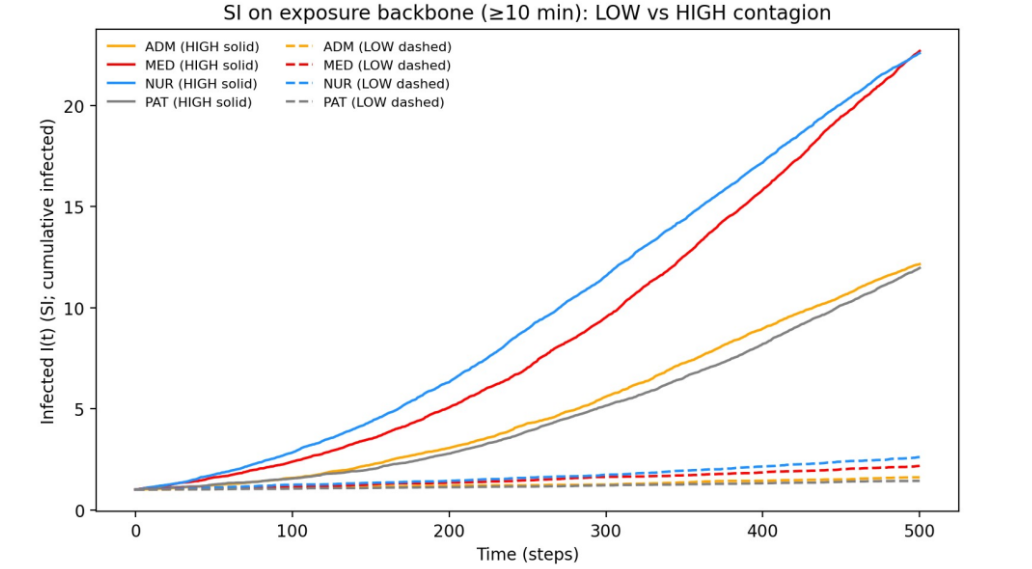
Simulation Experiment: Low vs. High Contagiousness
Let \(X_j(t)\) denote the infection status of individual j at time t. A susceptible individual j becomes infected at time t+1 if they have contact with any infected neighbor \(i \in N_I(j,t)\). The probability of this state transition is:
$$\Pr(X_j(t+1)=I \mid X_j(t)=S) = 1 - \prod_{i\in N_I(j,t)} \big(1-p_{ij}(t)\big)$$Based on this framework, I designed a simulation experiment comparing two disease scenarios:
- LOW Contagion: `inf.prob = 0.0002` (representing a pathogen with lower transmissibility).
- HIGH Contagion: `inf.prob = 0.001` (representing a highly infectious pathogen).
For each scenario, the infection was seeded in a single randomly selected individual from a specific role (ADM, MED, NUR, or PAT). Stochastic simulations were repeated to generate robust distributions of outcomes.
This experimental design addresses a clear policy question:
If the index case appears in a specific role, how large might the outbreak become under different levels of contagiousness?
Results: The Two-Regime System (Firebreak vs. Wildfire)
The simulation results reveal that the hospital network behaves as a non-linear system. It switches between two distinct states — Containment vs. Saturation — depending on the pathogen’s ability to bridge the structural gaps in the network.
| Index Role | LOW Regime (Takeoff Prob) | HIGH Regime (Takeoff Prob) | Risk Multiplier |
|---|---|---|---|
| MED (Physician) | 4.0% | 92.5% | 23x |
| NUR (Nurse) | 5.0% | 91.0% | 18x |
| ADM (Admin) | 1.0% | 54.5% | 54x |
| PAT (Patient) | 0.5% | 52.5% | 105x |
A. The “Firebreak” Regime (Low Contagion)
In the Low scenario, the network topology works for us.
- Outcome: The takeoff probability is negligible across all roles (≤ 5%).
- Mechanism: The structural holes between patient rooms and the sparsity of the backbone act as natural firebreaks. Even when a Nurse (NUR) is the seed, the infection typically burns out before establishing a chain of transmission.
B. The “Saturation” Regime (High Contagion)
In the High scenario, the system undergoes a phase transition.
- Outcome: The clinical core (MED/NUR) transforms into a “super-highway.” If the infection starts in a Physician, there is a 92.5% probability of a sustained outbreak.
- Structural Equivalence: Notably, Physicians (92.5%) and Nurses (91.0%) are effectively equivalent super-spreaders. Both roles act as the “ignition switch” for the ward.
C. The Critical Transition
The most important finding is the fragility of the Admin/Patient periphery.
- - In the Low scenario, ADM/PAT seeds are negligible risks (< 1.0% takeoff).
- Structural Equivalence: Notably, Physicians (92.5%) and Nurses (91.0%) are effectively equivalent super-spreaders. Both roles act as the “ignition switch” for the ward.
Policy Implications: Adaptive Precision IPC
The contrast between the two scenarios supports a strategy of Adaptive Precision Infection Prevention and Control(IPC). Policies should switch gears based on the estimated transmissibility (R0) of the threat.
1. Baseline Mode (For Low-Contagion / Endemic Pathogens)
- Context: MRSA, seasonal flu (lower R0).
- Strategy: Standard Precautions & Symptomatic Testing.
- Rationale: The simulation shows that for lower `inf.prob`, the network’s natural topology effectively contains spread. Identifying and isolating symptomatic “seeds” is sufficient because the network resists “takeoff.”
2. Surge Mode (For High-Contagion / Pandemic Pathogens)
- Context: COVID-19 (Omicron), Measles, Novel Respiratory Viruses.
- Strategy: Structural Fragmentation (Cohorting).
- Rationale:
When ‘inf.prob’ is high, the natural network barriers fail. We must artificially induce the “Low Regime” by cutting edges in the network.
- Action: Implement “Pod Nursing” (Assigning specific nurses to specific rooms exclusively) to manually recreate the structural holes that the virus has learned to jump.
- Action: Ban “Floating” staff (who move between wards), as they provide the bridging ties that allow the high-contagion wildfire to spread between components.
3. Physician-Specific Interventions
- Insight: In the Low contagion scenario, Nurses presented a slightly higher risk of initiating an outbreak than Physicians. However, in the High contagion scenario, the dynamic shifts: Physicians become the primary “global” bridges, exhibiting the highest probability of connecting otherwise disjointed patient groups.
- Policy: Consequently, physician workflows should be modified to prioritize “virtual rounds” or “tele-consultations” during high-transmissibility surges. This intervention directly reduces the number of physical edges physicians create in the network graph, effectively severing the “super-highway” of transmission while maintaining clinical oversight.
References
Jenness et al. (2018). EpiModel: An R Package for Mathematical Modeling of Infectious Disease over Networks. Journal of Statistical Software, 84, 8.
Vanhems et al. (2013). Estimating Potential Infection Transmission Routes in Hospital Wards Using Wearable Proximity Sensors. PLOS ONE, 8(9), e73970.